
In many other areas of Australia, low lying sports grounds give an early warning of risks to communities from the sea level rise which is being driven by global warming, caused by greenhouse gas emissions.
In the Newcastle area, whole communities are at serious risk.
Global warming means warming oceans, and water expands as it warms. So, sea levels are rising – around 200mm last century and accelerating.
These assessments are based on the OzCoasts maps for Newcastle and the Central Coast. In most cases assessments are given here for 50cm and 1.1 metre sea level rise impacts only but in a few instances assessments based on the maps for OzCoasts “middle” case of 80cm sea level rise are also provided.
Of course, many of these areas are already exposed to flooding risk. But sea level rise will make flooding more frequent and more severe. And if carbon pollution continues unabated we may see even worse rises in sea level than OzCoasts has so far mapped.
Local Federal Labor members Pat Conroy, Sharon Claydon and Jill Hall have all stood up for climate action.
- Jill Hall has pointed out that the majority of most of electricity price rises are because of State Liberal Governments including in NSW, not because of carbon pricing.
- As Pat Conroy said, in opposing Tony Abbott’s attempts to reverse action on climate change including abolishing the Climate Change Authority and the Clean Energy Finance Corporation, “no other government in the world questions the science and no other Prime Minister calls the science ‘crap’.”
- As Sharon Claydon said in campaigning and in her maiden speech, Labor supports real action on climate change.
It’s hard to work out from public statements what Bob Baldwin, member for Paterson, thinks about the science of climate change. He likes to turn up and claim credit for Labor initiatives on renewable energy. But we do know which way he voted on climate action – the wrong way, with Tony Abbott.
- Some of the fields at the King Park sporting complex at Raymond Terrace are just above inundation level on OzCoasts map for the impacts of 11o cm sea level rise. The athletics field at the south west corner isn’t – it shows as fully inundated

The Newcastle junior competitions also include kids from further north at Nelson Bay and Port Stephens. Their home grounds don’t appear on OzCoasts map yet, and look slightly higher above sea level on Google Earth and other sources. But they won’t be able to play as visitors at many Newcastle grounds if the oceans are allowed to rise much higher.
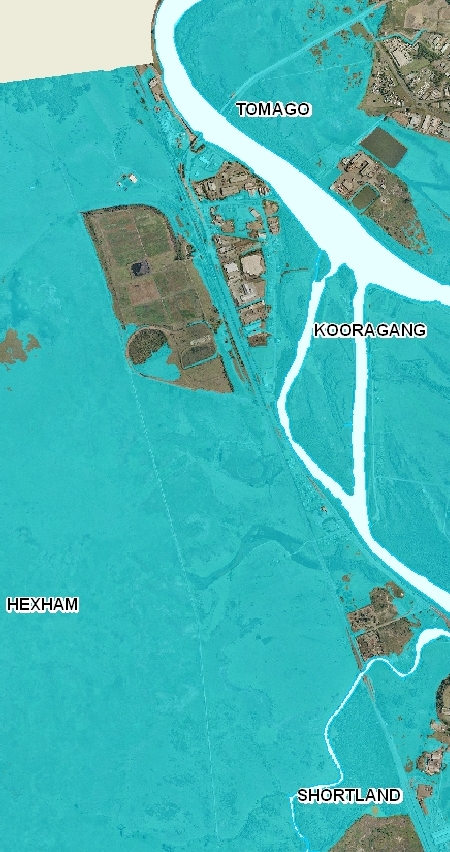
- Hexham Park shows as completely inundated on OzCoasts map for the impacts of 110 cm sea level rise, together with most of the surrounding district – including a section of the Pacific Highway and a substantial section of the main north railway.
- Birmingham Gardens Sports Club and Harold Myers Park both experience inundation with 1.1 metres sea level rise

- Aitchison Reserve, Pelican: With 1.1 metre sea level rise the ground is just above water at high tides, but much of the surrounding area is submerged
- Stockton: Griffith Park experiences inundation with 1.1 metre sea level rise; and just avoids inundation with 50cm sea level rise. Ballast 1 and 2 would both be inundated with 1.1metre sea level rise; both would just avoid inundation with 50cm sea level rise

- Swansea: Quinn Park and Parbury Park are shown as experiencing inundation with 1.1 metre sea level rise; and as just above inundation level with 50 cm sea level rise. Chapman Oval , with much of the surrounding area, would experience inundation with 1.1 metre sea level rise. The ground would experience significant inundation even with 50 cm sea level rise.

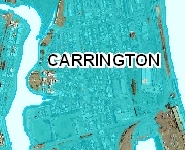
- Carrington: Substantial inundation of Connolly Park and Pat Jordan Oval, together with the entire surrounding area, would occur with 1.1 metre sea level rise. The grounds just miss inundation with 50 cm sea level rise

- Wickham Park, Hamilton: Along with much of the surrounding area the grounds show as experiencing inundation on OzCoasts map for impacts of 110 cm sea level rise

- National Park, Newcastle: Each of the sports grounds including the tennis courts show substantial inundation with 110 cm sea level rise

- Islington Park: The ground would experience substantial inundation with 1.1 metre sea level rise, along with much of the surrounding area.

- Federal Park, Wallsend: Inundation of both (northern) synthetic pitches, and inundation of the southern ground to close to the turf wicket, would be experienced with 1.1 metre sea level rise. All 3 pitches are just above inundation level with 50cm sea level rise

- Warners Bay: Warner Park experiences major areas of inundation with 1.1 metre sea level rise; and is just above inundation level for 50 cm sea level rise. Feighan Park starts to show inundation at 1.1 metres sea level rise.

- Rathmines : The ground experiences some inundation with the impacts of 110 cm sea level rise

- Walters Park, Speers Point: The ground would experience substantial inundation with 1.1metre sea level rise; and partial inundation with 50 cm sea level rise

- Toronto sports ground: the grounds show as experiencing partial inundation with the impacts of 1.1 metres sea level rise

- Tulkaba Park in Teralba shows as fully inundated on the map for impacts of 110 cm sea level rise

- Water Board Memorial Oval, Blackalls Park: Major inundation would occur with 1.1 metre sea level rise; the ground is shown as just above inundation level for 50 cm sea level rise

- Douglass St Oval, Dora Creek: The ground experiences inundation of outer areas with 1.1 metre sea level rise


Climate change – the time for games is over
Authorised by David Mason, 47 Charles St Marrickville NSW

Thanks to climate blogger http://uknowispeaksense.wordpress.com for checks on statements by Federal MPs on climate science.